It’s been tough trying to find the right home these past few years—but the good news is, that’s finally starting to change.
There are more homes hitting the market across the country, which means more choices for your next move. But keep in mind—how much inventory is growing really depends on your local area. That’s why having a local expert by your side makes all the difference.
Let’s break down what the housing inventory looks like right now, so you’re in the know and can plan ahead.
Significant Growth Across the Nation
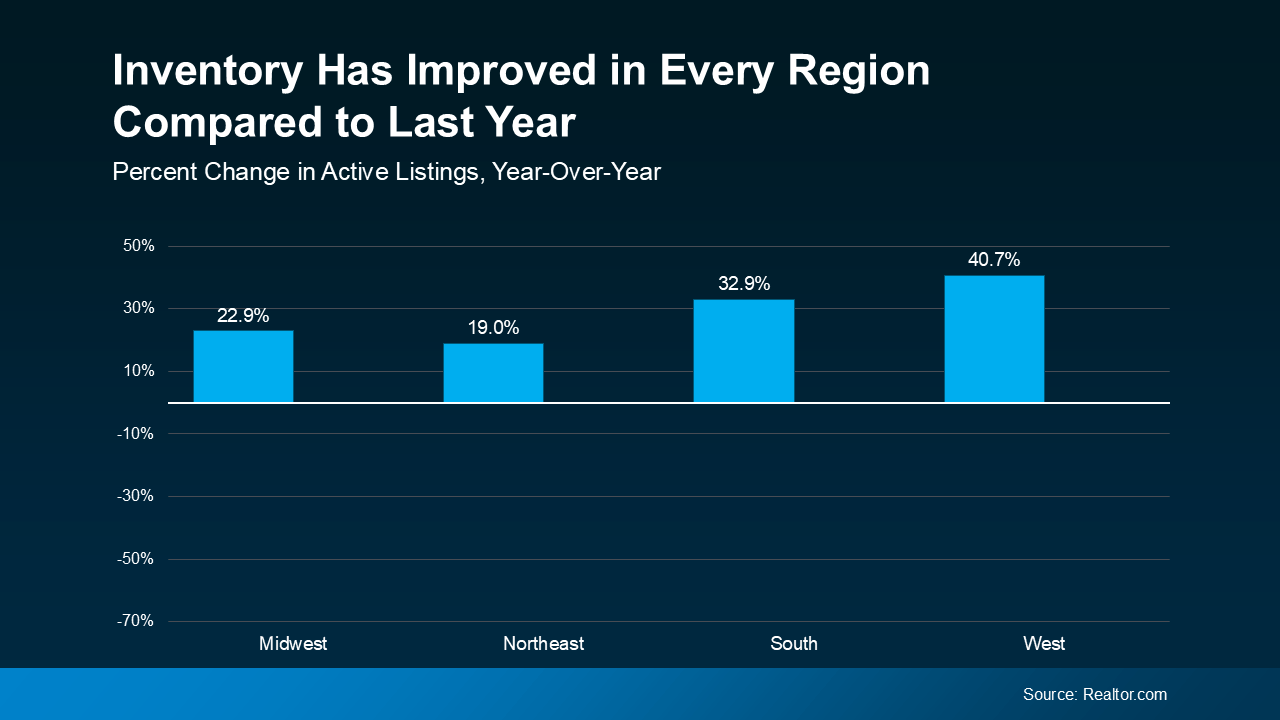
Across the country, we’re seeing more homes for sale—and that trend is showing up in every region. According to Realtor.com, inventory is up by at least 19% in all four regions compared to this time last year. Out West? It’s jumped nearly 41%! (Check out the graph below 👇)
There are two main reasons for this increase:
- More homeowners are finally putting their homes on the market. A lot of people were holding out, waiting for mortgage rates to come down—but now, some have decided they just can’t wait any longer. In fact, this past May saw more new listings than any other May in the last three years!
- Homes are starting to take a bit longer to sell, which means listings are sticking around and adding to the overall inventory. In May, the average home took about 51 days to sell—getting us back to a pace that’s more in line with a ‘normal’ market.
Having more homes on the market is helping things level out. For a while, sellers had all the power—but that’s starting to change. We’re not quite in a full-on buyer’s market yet, but we’re definitely moving toward a more balanced and buyer-friendly environment. As Danielle Hale, Chief Economist at Realtor.com, puts it:
“The number of homes for sale is rising in many markets, giving shoppers more choices than they’ve had in years . . . the market is starting to rebalance.”
How Much Growth We’ve Seen Varies by Area
But how quickly we’ll see a truly balanced market really depends on where you are. Some areas are already seeing inventory return to more normal levels, while others still have a bit of catching up to do.
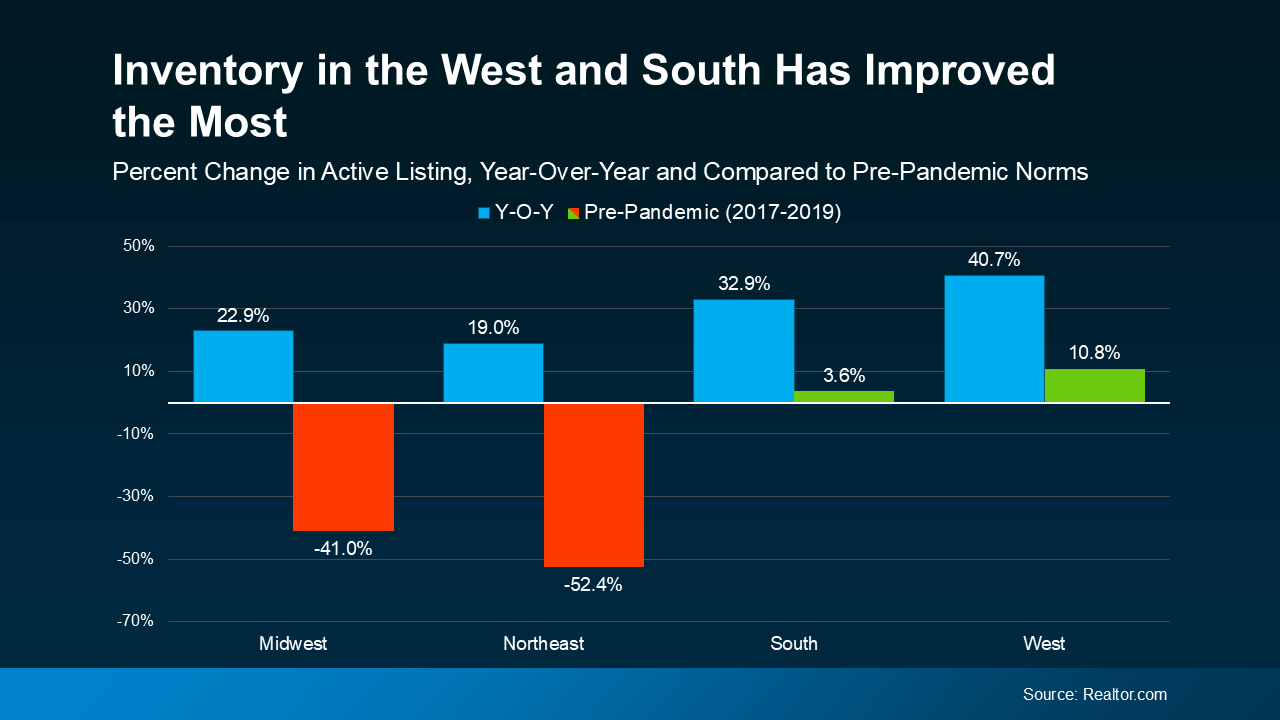
Now let’s check out another graph—this one compares today’s numbers (which you’ve already seen) to what things looked like during the last ‘normal’ years in real estate, from 2017 to 2019.
In this chart, the green highlights the regions where inventory has bounced back to more typical levels based on recent growth. The red shows areas that are making progress, but still have a ways to go to catch up. (Check out the graph below 👇)
So, what does this mean for you? Simply put—you’ve got more options now than you did a year ago, and that’s great news. With more homes to choose from, it should be a little easier to find one you really love.
But every market’s different—some areas might take a little longer to get back to normal inventory levels. That’s why it’s so helpful to work with a local agent. They’ll give you the inside scoop on what’s happening in your area, how much inventory has grown, and how to adjust your search based on what’s actually available. It’s just one of the many reasons having a local expert on your side really matters.
Bottom Line
Inventory is definitely improving, but how quickly things return to normal really depends on where you’re looking to buy. Let’s chat about what’s going on in our local market and what it means for your next move.
Have you noticed anything lately that feels different about the market compared to a year or two ago?