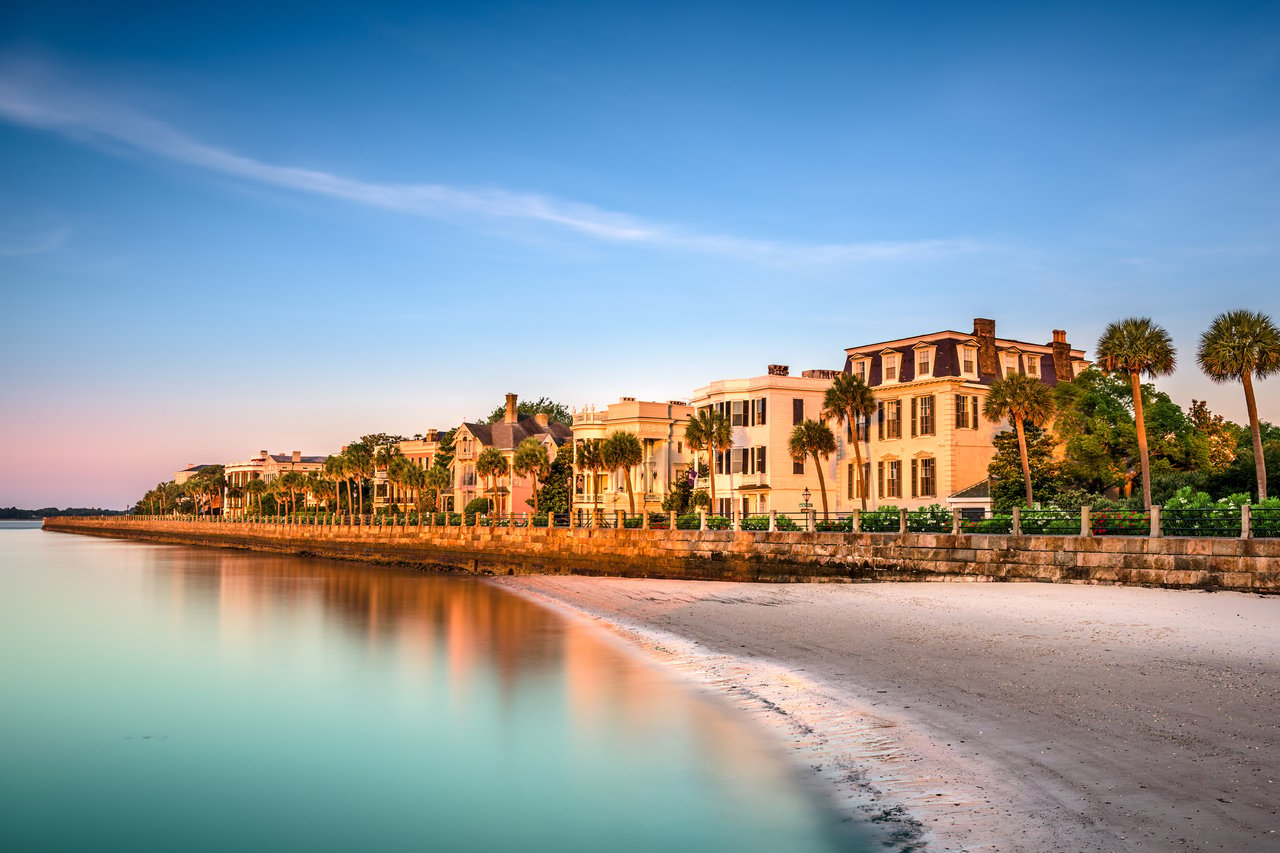
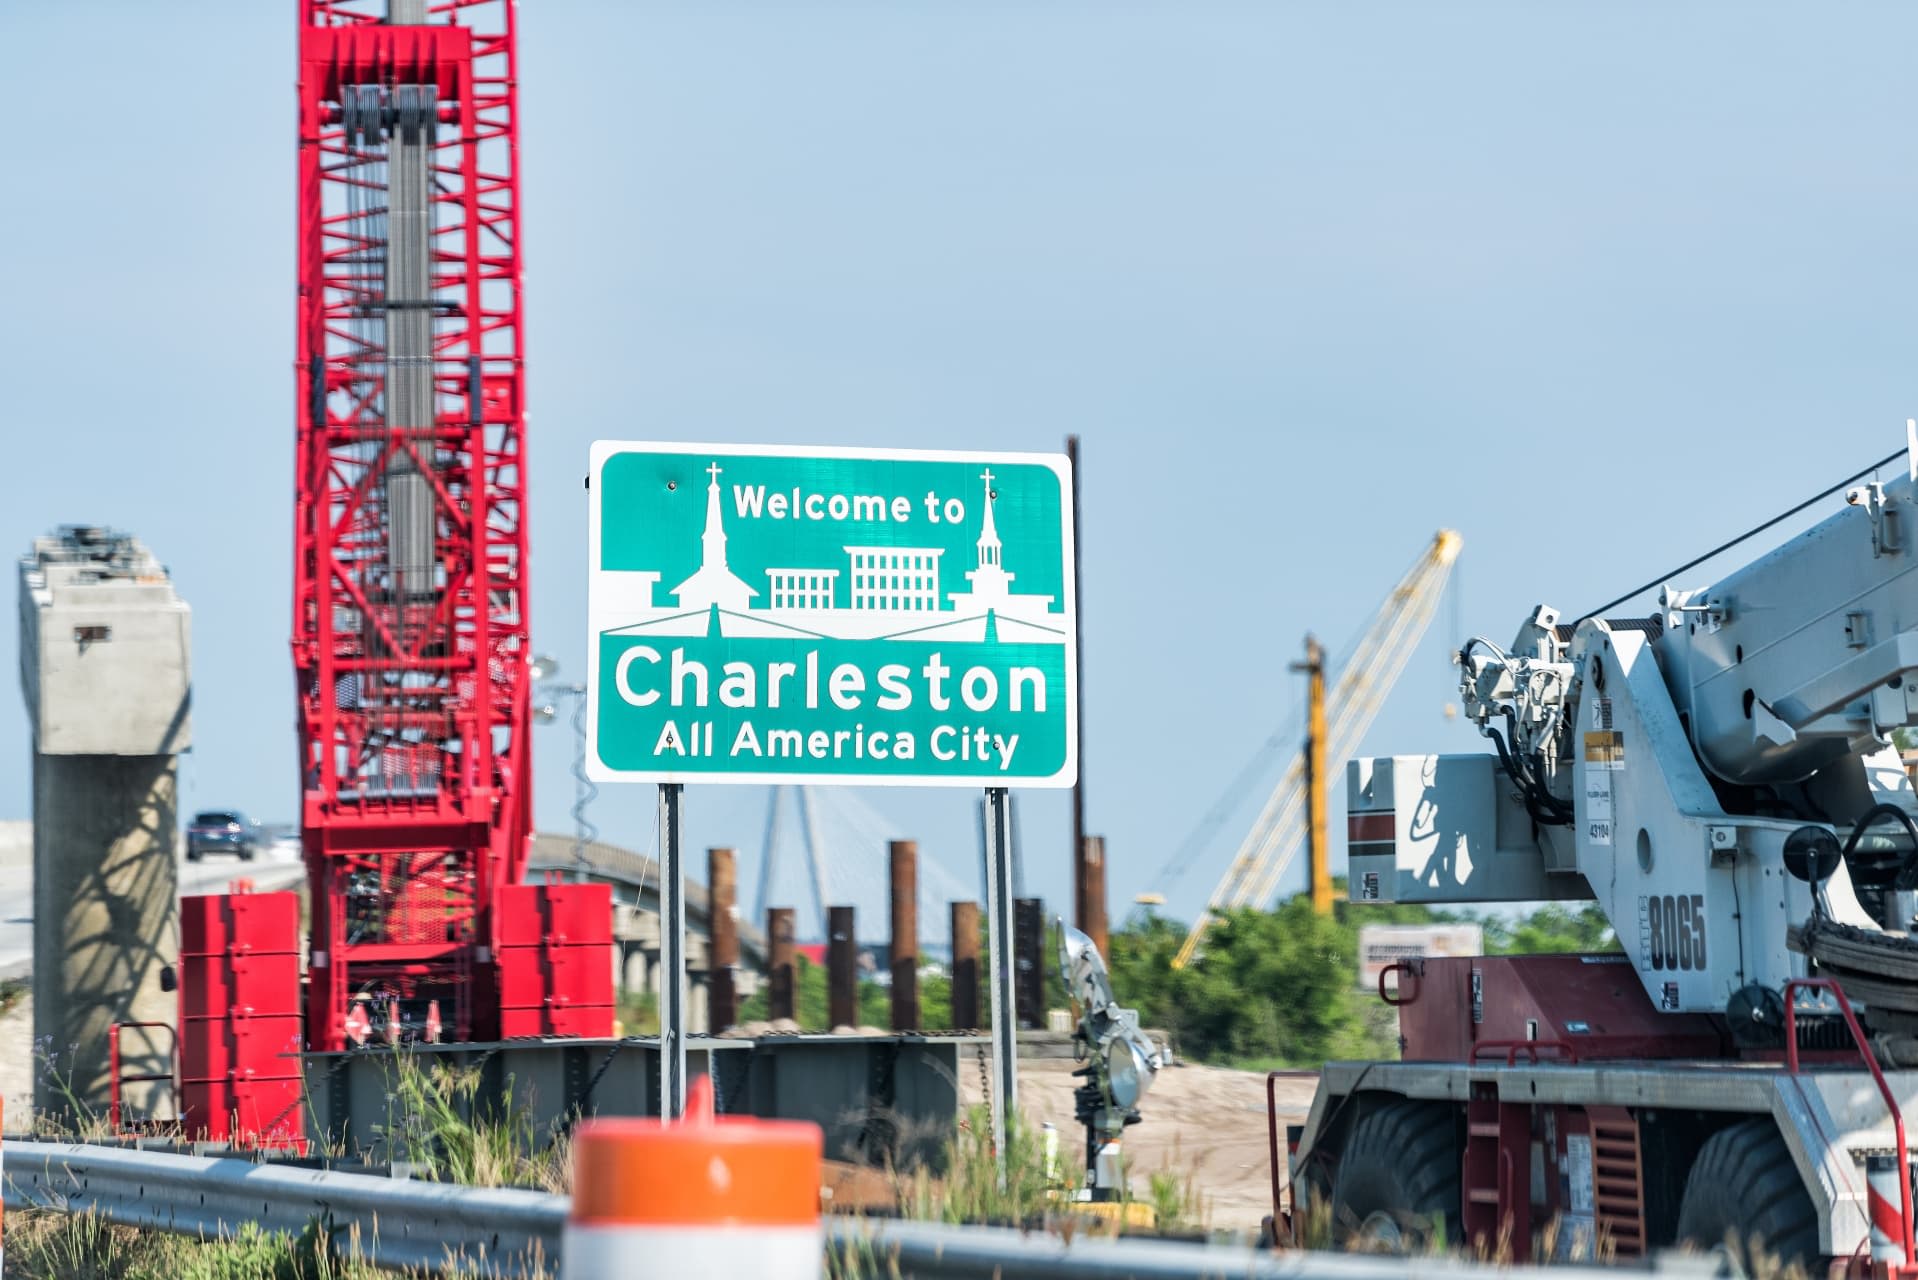
In the second quarter of 2024, Charleston’s office market experienced its first quarter of positive absorption in a year, setting it apart from many larger Southeastern markets. Even though vacancy rates rose slightly to 7.7%, they remain well below the national average. Robust job growth over the past several years has played a significant role in attracting office-using industries to the region. While employment expansion has slowed nationally, Charleston has seen an overall payroll increase of almost 13% since February 2020.
Entering the second half of 2024, rent growth in Charleston has leveled off. The year-over-year growth rate of 3.3% surpassed the national average, but it remains below the pre-pandemic rate of 5%. The average office rent in Charleston is currently around $32.00 per square foot, notably higher than rents in other South Carolina markets like Greenville and Columbia.
As 2024 progresses, job growth in Charleston has been steady and across all sectors. The market continues to attract newcomers from across the U.S., consistently outpacing national job growth rates. Since 2020, over 46,000 jobs have been added locally, representing a 12% increase in total payrolls. Despite a slowdown in larger Southeastern markets and across the nation, Charleston saw a 4.5% year-over-year increase in total employment as of May 2024.
New construction in Charleston has slowed considerably, but the market is still adjusting to a significant wave of development. Since 2020, over 2 million square feet of primarily high-end office space has been completed, with an additional 160,000 square feet currently in progress. The majority of this new space has been successfully leased, with approximately 90% of post-2020 deliveries finding tenants. However, only 15% of the space currently under construction has secured leases. A trend of tenants relocating from older buildings to these newly developed trophy spaces has emerged. Notable developments include Morrison Yard (135,000 square feet) and The Morris (106,000 square feet), both delivered in 2023 on the northern edge of the Charleston peninsula. These buildings have drawn tenants from older downtown properties, with Morrison Yard nearly fully leased and The Morris at approximately 84% occupancy.
67.6K
12 Mo Deliveries in SF
67.9K
12 Mo Net Absorption in SF
7.6%
Vacancy Rate
3.3%
Market Asking Rent Growth
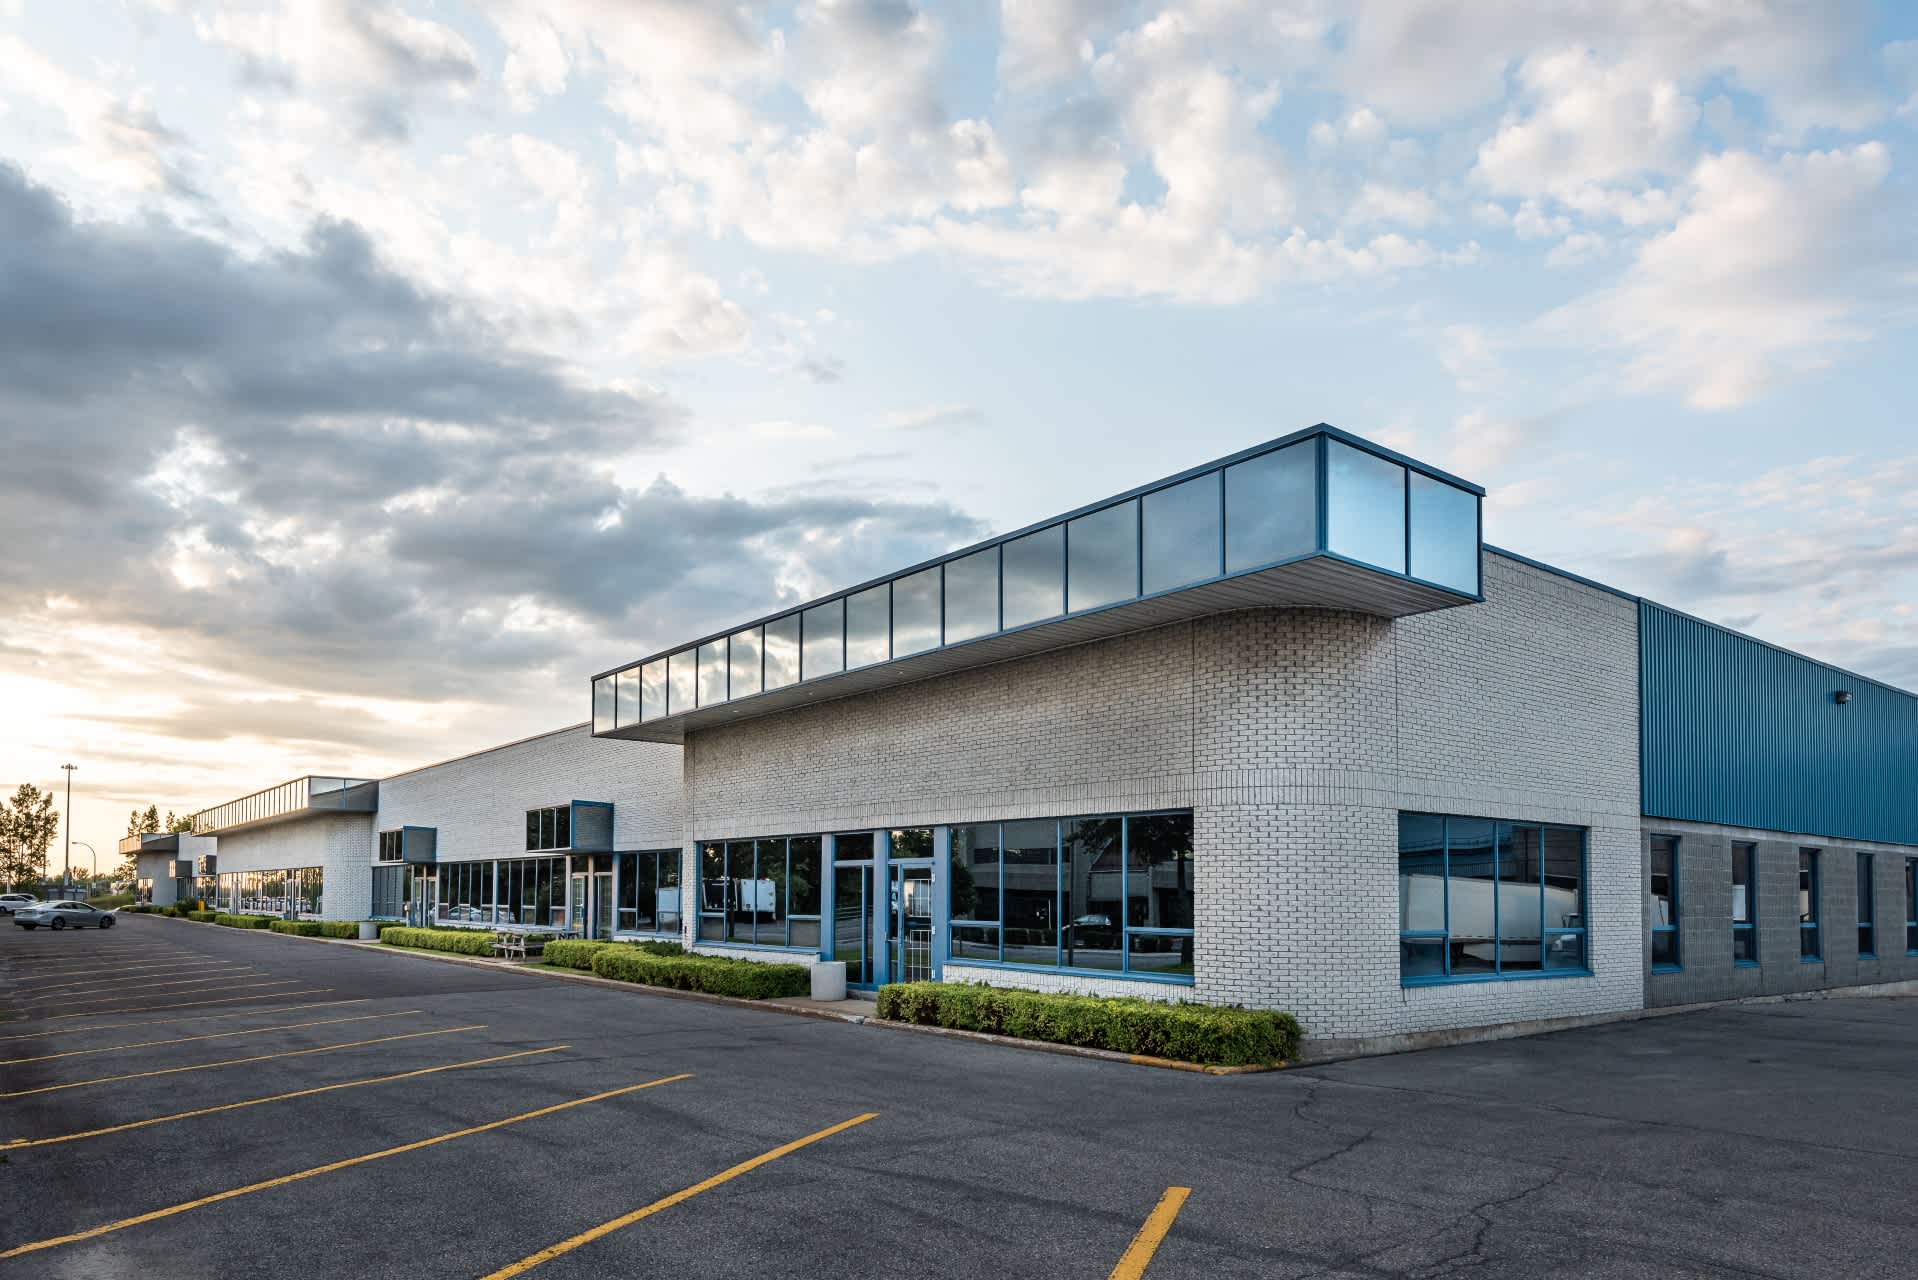
Charleston’s industrial market has experienced a notable slowdown heading into the final months of 2024. The dynamic between supply and demand has significantly shifted, with vacancies climbing over 700 basis points from the record lows seen in late 2022. This shift is due to a combination of reduced demand and an influx of new
speculative supply, turning Charleston from one of the nation’s tightest markets to one with vacancy rates now exceeding the national average. However, the pressure from new supply is expected to ease by 2025, as inventory expands by an additional 2.5%.
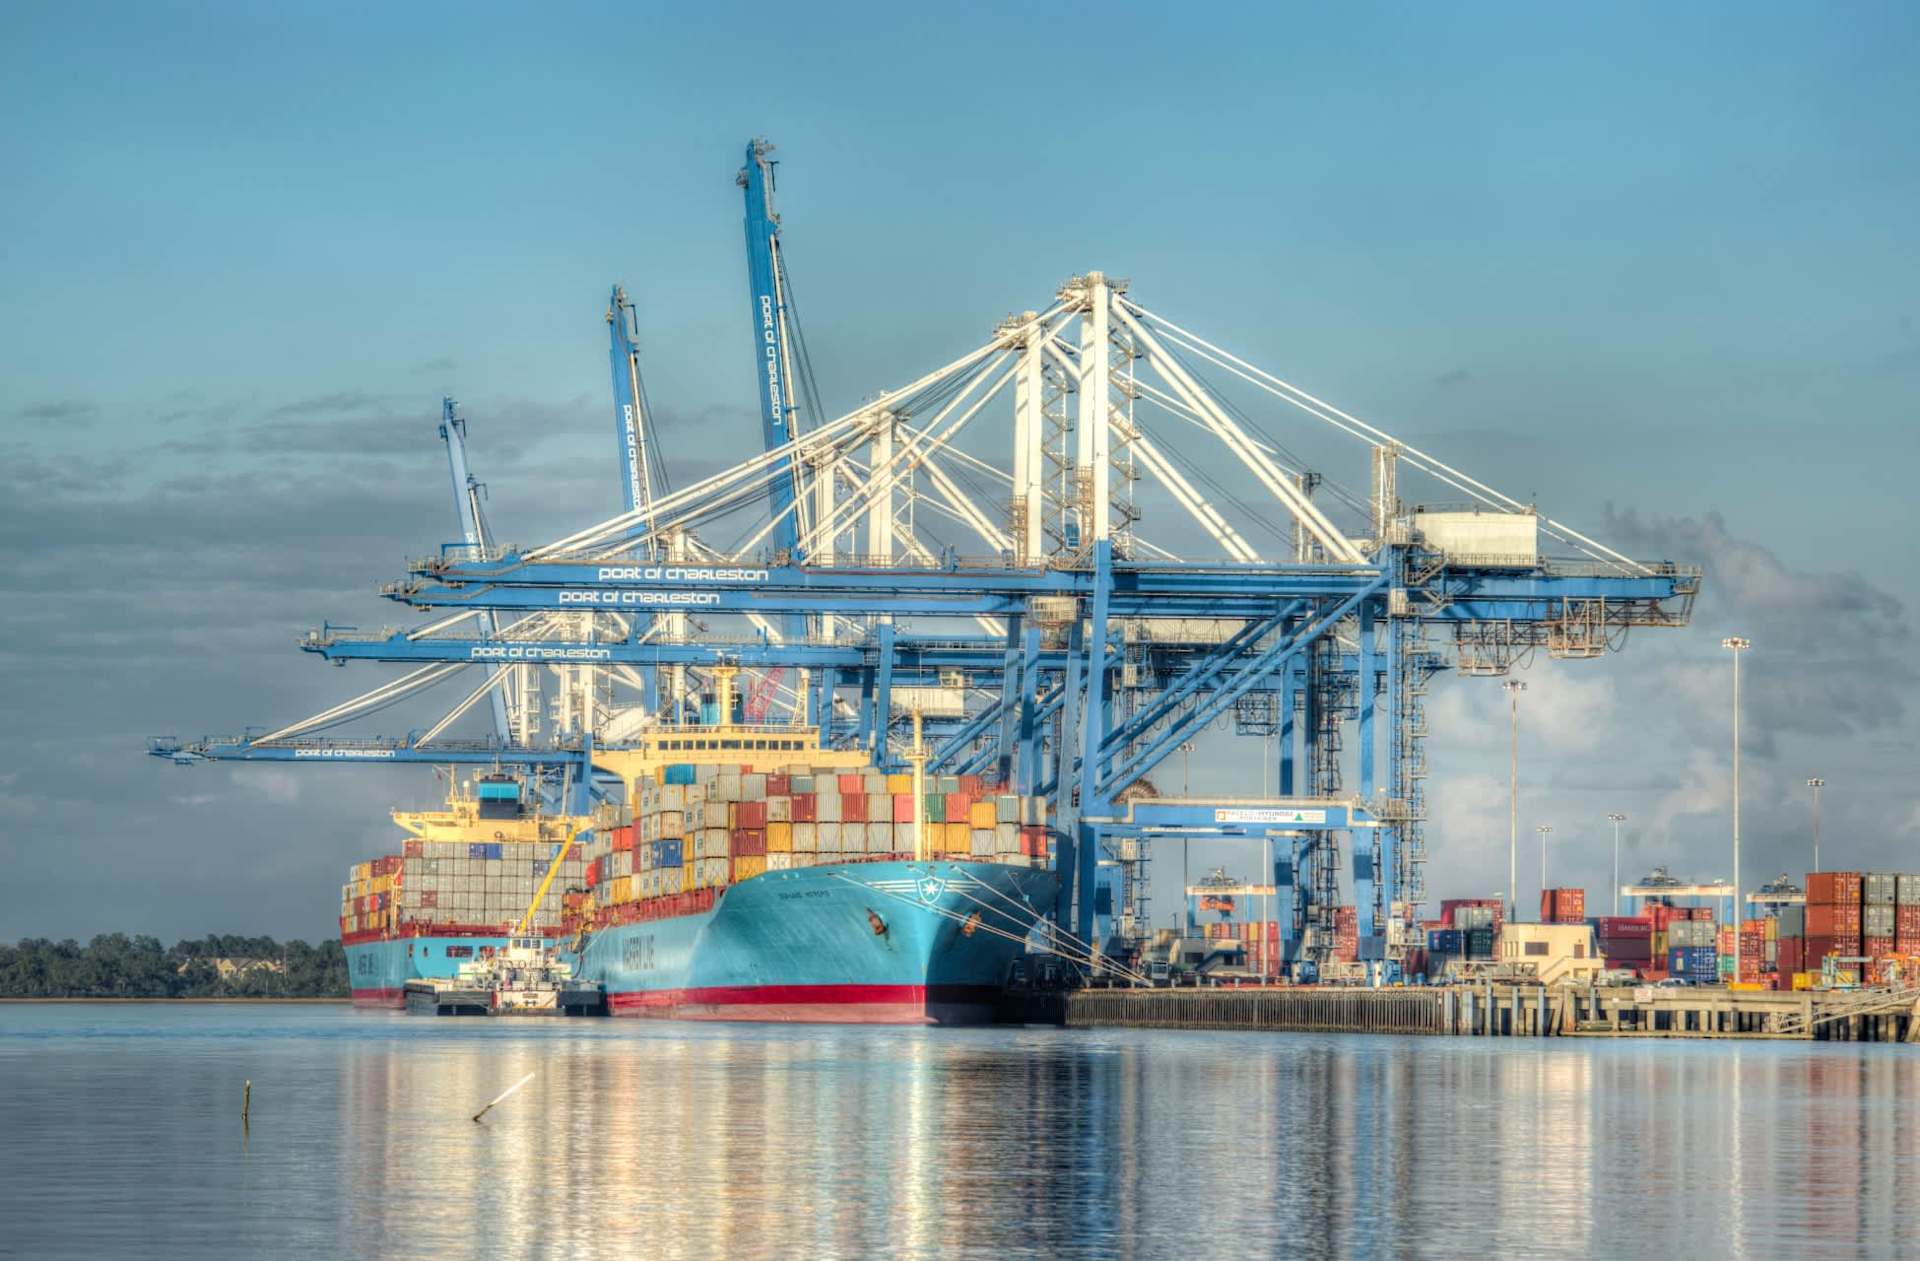
The primary driver of industrial demand in the region is the Port of Charleston. While import volumes showed a slight increase in the first half of 2024, overall activity remains far below the peak levels of 2021 and 2022. This decline is partly due to consumer spending trends shifting from goods to services. The decreased port activity has
contributed to weaker demand for distribution services, leading to Charleston’s first notable negative absorption figures in three years as of the first half of 2024. Furthermore, sublease space has more than doubled, with large blocks of space hitting the market from third-party logistics firms like 3G Distribution, Quantix Supply Chain,
and Tri-Modal.
Due to wetland protections, construction near the busy Wando Welch terminal is challenging. Consequently, much of the market’s development has expanded along the I-26 corridor to the northwest, where greater land availability and infrastructure like the Charleston International Airport have drawn major manufacturers, including Boeing, Volvo, and Mercedes. However, speculative warehouse development in areas such as Berkeley and Dorchester counties has resulted in availability rates exceeding 15%, especially as demand for larger spaces has waned. Currently, around 65% of the supply delivered since 2020 is leased, but only 20% of the 2.8 million square feet under construction—most of which is in buildings over 250,000 square feet—has secured tenants. In contrast, availability in smaller buildings under 100,000 square feet remains below 5%.
The softened demand and growing supply have slowed annual rent growth from a high of over 12% in 2022 to a still-solid 4.6% year-over-year pace. This rate is expected to decelerate further if vacancies continue to rise through the end of 2024. The impact of tighter credit markets has reduced new construction activity significantly, with starts on a trailing four-quarter basis down by nearly 75% year-over-year in the second quarter of 2024. This reduction in new starts suggests fewer deliveries in the next 12 to 18 months, which could lead to a drop in vacancy rates and a potential rebound in rent growth by late 2025.
9.2M
12 Mo Deliveries in SF
521K
12 Mo Net Absorption in SF
13.2%
Vacancy Rate
4.6%
Market Asking Rent Growth
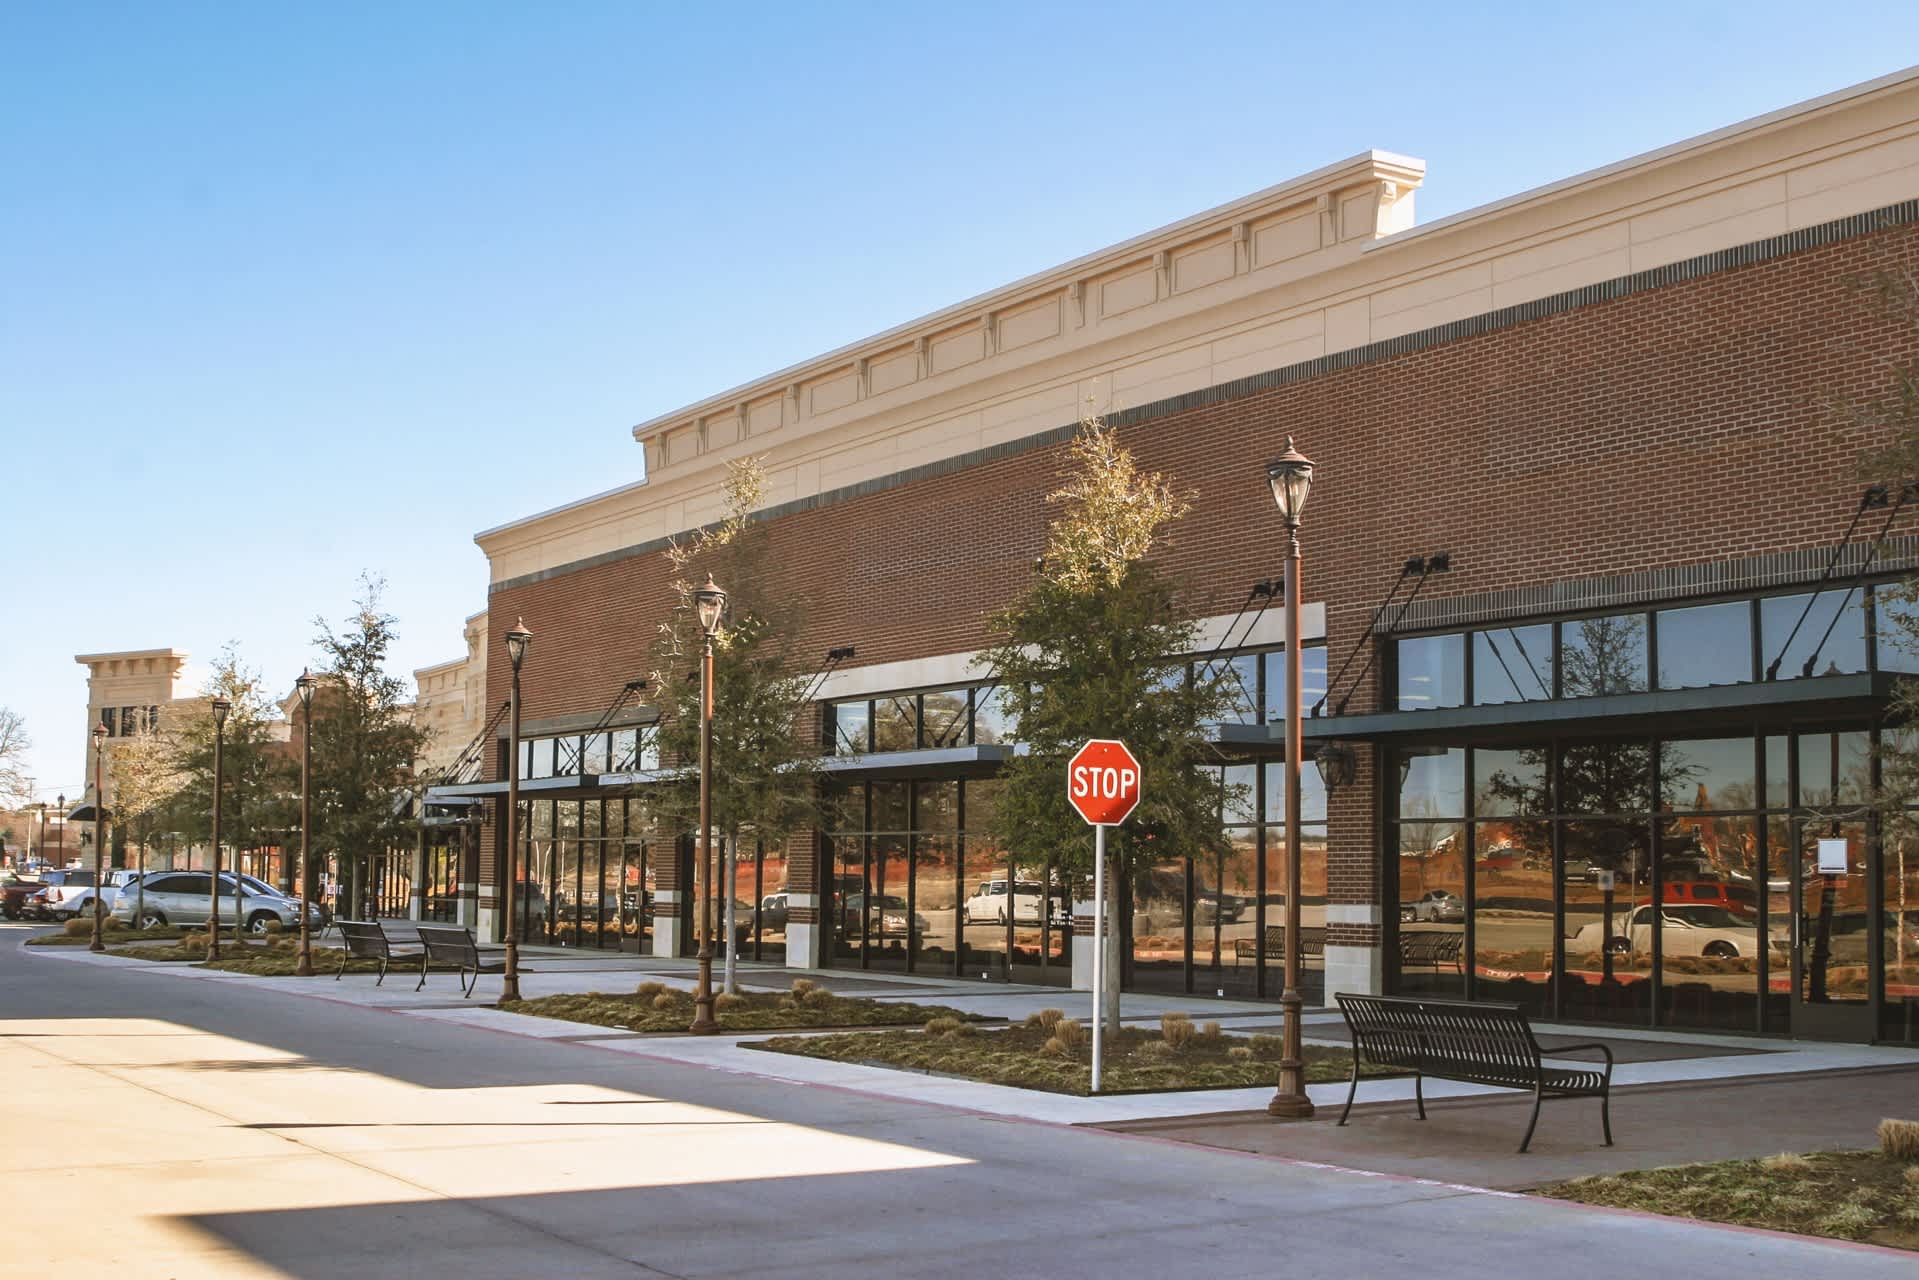
Tourism, in-migration, and ongoing job growth have helped sustain retail demand in Charleston through the second half of 2024. After a brief dip in late 2023, leasing activity surged in early 2024. With only 3.4% of retail space available, the market remains near historic lows for vacancy, a trend that's persisted for the past two years. This shortage of space has been a challenge for tenants but a major advantage for property owners, as the strong demand has kept fundamentals solid and allowed for quick re-leasing of vacated spaces.
Charleston's retail demand is driven by a blend of coastal tourism and a growing industrial base. The city's historic downtown attracts visitors, while suburban areas like Summerville, Daniel Island, and Mount Pleasant have spurred housing growth, drawing a wide range of retail brands catering to diverse consumers. Leasing activity picked up in early 2024 after a dip in consumer spending in late 2023. For the year ending in the second quarter of 2024, leasing volume reached approximately 1 million square feet, a 14% increase from the fourth quarter of 2023
Retail rents in Charleston continue to rise year over year, although the pace of growth has slowed in the latter half of 2024. As South Carolina's most expensive retail market, average rents are around $26.00/SF, with notable differences between premium urban spaces in Downtown and suburban areas. Currently, rents have increased by 4.2% year over year, down from a peak of nearly 6% in 2022. Strong tourism and robust job growth have maintained retail demand, while historically tight supply has supported rent increases, especially in suburban power centers and neighborhood centers, which have seen rent growth of 5.6% and 4.7%.
In 2024, retail property sales have outshone other types of real estate, driven by steady rent growth and constrained inventory. Nevertheless, elevated interest rates have increased debt financing costs, complicating larger transactions. As a result, retail sales in Charleston have dropped about 16% compared to the previous year and are more than 63% below the peak levels reached in mid-2022, totaling around $320 million in sales over the last 12 months. Average cap rates have risen over 100 basis points, shifting from the high 4% range to the high 5% range, while triple-net investment deals in suburban areas have been completed at lower rates.
417K
12 Mo Deliveries in SF
278K
12 Mo Net Absorption in SF
3.2%
Vacancy Rate
4.2%
Market Asking Rent Growth
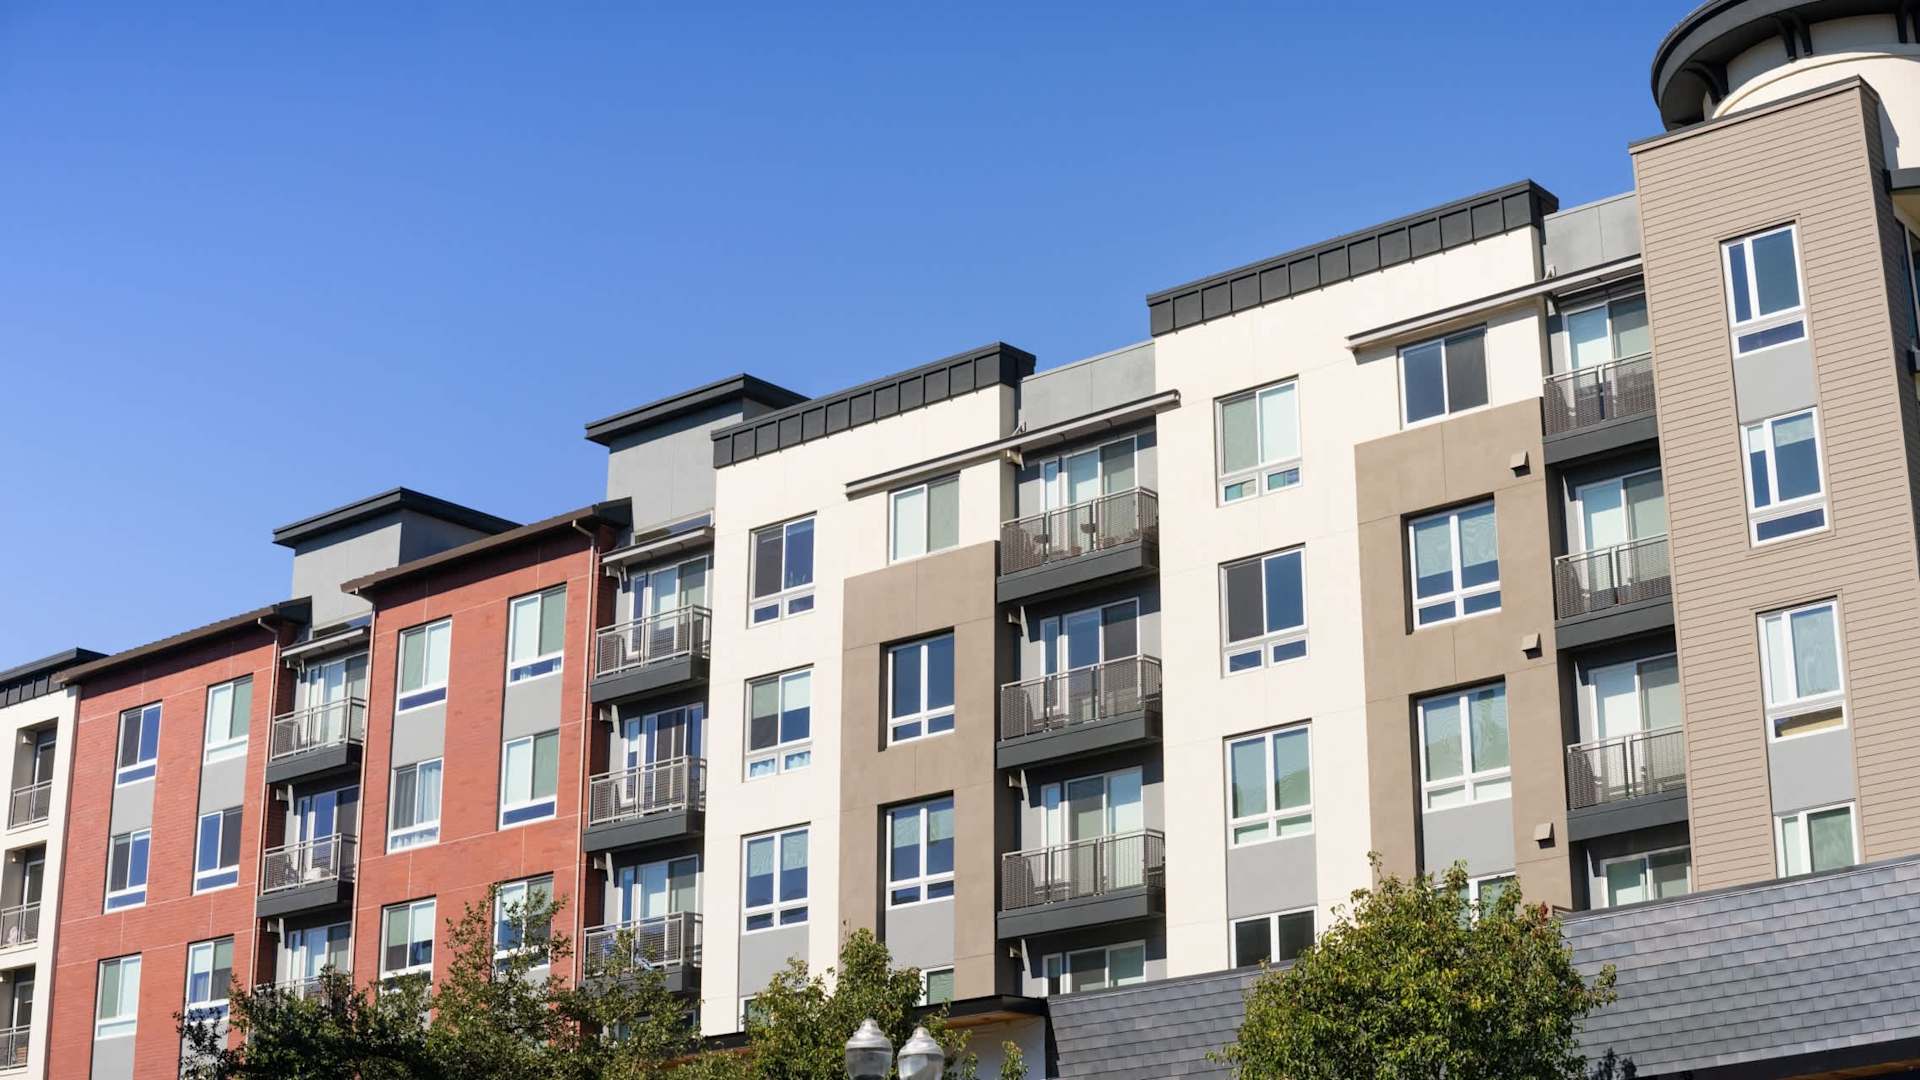
A robust spring leasing season, exceeding expectations, along with gradual easing of supply pressures, has boosted optimism among multifamily operators in Charleston as they approach the end of 2024. Continued population and household growth have sustained strong apartment demand. Despite the recent surge in supply, net absorption surpassed new deliveries for the first time in two years during the second quarter of 2024.
A prolonged supply surge has pushed the vacancy rate to 10.2%, which is notably above the national average but remains close to the market's 10-year historical norm and significantly lower than in some larger Southeastern cities. The increase in vacancies is primarily driven by new supply, with over 5,200 units delivered in the past year and an additional 3,900 units currently under construction. Although this represents a substantial 5.4% growth in the existing inventory, it is well below the nearly 8,000 units under construction at the height of early 2023. With few new projects breaking ground in 2024, the construction pipeline is expected to shrink further into 2025.
Apartment leasing activity in Charleston has gained momentum as 2024 approaches its final months. Net absorption reached over 2,300 units in the first half of the year, marking the strongest performance since 2021. The second quarter of 2024 also saw net demand outpace new supply for the first time in two years.
Demand has exceeded expectations, and with a slowdown in new supply deliveries, rent growth in Charleston has started to bounce back as 2024 comes to a close. Earlier in the year, rents had leveled off due to a surge in supply, but with demand now surpassing supply in the second quarter, rents have climbed 0.9% year over year. This growth outperforms larger markets like Charlotte and Atlanta, both of which have seen declines. Charleston remains one of the most expensive rental markets in South Carolina, with average rents around $1,810 per month, even higher than in Charlotte and Atlanta.
Charleston's growing population, employment gains, and record apartment demand have made its multifamily market appealing to investors. However, challenges in the capital markets have caused a 50% drop in multifamily investment year over year. In the past 12 months, about $938 million in transactions have occurred, setting the market up for a slower 2024 compared to the peak of 2022, when $1.7 billion in deals closed.
5,166
12 Mo Delivered Units
4,060
12 Mo Absorption Units
10.2%
Vacancy Rate
0.9%
Market Asking Rent Growth
Over the past year through August, hotel performance in the Charleston market has seen a slowdown. While RevPAR remained slightly positive in the first six months, a significant decline of 9.2% in July pushed the year-to-date figure into negative territory. Despite this, Charleston’s hotel market is still performing better than many other leisure destinations, which have been impacted by changes in travel patterns.
The last 18 months have seen a shift in travel behavior favoring international trips and cruises, impacting domestic hotel demand. Additionally, economic factors are affecting Charleston’s hotel performance. The depletion of excess savings accumulated during the pandemic, combined with rising inflation and higher interest rates, has made consumers more cautious. As a result, both occupancy rates and average daily rates (ADR) are expected to see modest declines in 2024.
Charleston’s strong appeal stems from its rich history, preserved downtown architecture, and cultural attractions like museums, providing a solid foundation for year-round hotel demand. Major events, such as the Spoleto Festival, Charleston Wine + Food, and MOJA Arts Festival, along with art shows, drive significant visitation from March through June and September through October. Proximity to popular beach destinations like Folly Beach and Isle of Palms, as well as activities like golfing and boating, further support hotel demand in the area.
The market is currently experiencing below-average growth in room inventory. Over the past 12 months, only two hotels with a total of 150 rooms opened. This has led to a modest change in hotel inventory, averaging a -0.2% growth over the past three years. Hotel investment activity in Charleston has also slowed, following national trends. Over the past 12 months, six hotels have been sold, with a cumulative sales volume of approximately $42 million. This is significantly lower than the typical average of 15 hotel trades per year. The three-year average annual sales volume for the market is around $230 million, highlighting a shift in investment patterns.
69.2%
12 Mo Occupancy
$172.91
12 Mo ADR
$119.62
12 Mo RevPAR
8.4M
12 Mo Supply
5.8M
12 Mo Demand